É TUDO RELATIVO GALILEU DESCOBRE QUATRO SATÉLITES DE JÚPITER
IO EUROPA GANIMEDES E CALISTO
PORTUGAL SÓ DESCOBRE A EUROPA EM 1986 E DEIXA DE RECONHECÊ-LA EM 2011
COISAS
HUYGENS DESCOBRE EM 1655 QUE ALÉM DOS 6 PLANETAS E DA LUA E DOS 4 QUE
GALILEU A JÚPITER DEU O SEXTO SATÉLITE TITÃ DE SATURNO....
PRONTO CONCLUI O GAJO 6 PLANETAS 6 SATÉLITES ESTÁ TUDO CERTO
CONCLUI PORTANTO DESCOBRI TUDO NÃO HÁ MAIS CORPOS CELESTES
INFELIZMENTE NINGUÉM O QUEIMOU E EM 1671 AINDA ERA VIVO
QUANDO CASSINI DESCOBRIU QUE SATURNO VINHA COM DOSE DUPLA DE SATÉLITE
E MAIS TARDE INDA DESCOBRE MAIS TRÊS SATUR SAT'S SATURETED IN SAT'S
joi, 8 mai 2014
joi, 20 martie 2014
CANTO O GELO....INÚTIL CANTO.... PRANTO GÉLIDO QUE ACALANTO FÚTIL PRANTO EMBORA DE HORA A HORA DE DIA A DIA O GELO EM MIM AQUECIA / EM MIM O GELO EM DEGELO ESQUECIA GELADO E SEM CATEGORIA MOLHADO E SEM VALIA O GELO EM DEGELO É A VONTADE É A VERDADE DE UMA CRIMINOSA MINORIA MUITO CREMOSA ALGUÉM DIZIA - ASSIM NUM PRELO DE GELO EM PELO PARA TODOS OS GOSTOS EM DESGOSTOS NA ESPESSA GELADA PLACA QUE SEM PRESSAS NOS CAPA GELADA EM NÓS A VOZ REPLICA O QUE O GELO EM DEGELO NOS SUPLICA.....
In the Arctic, winter’s might doesn’t have much bite
Overview of conditions

Figure
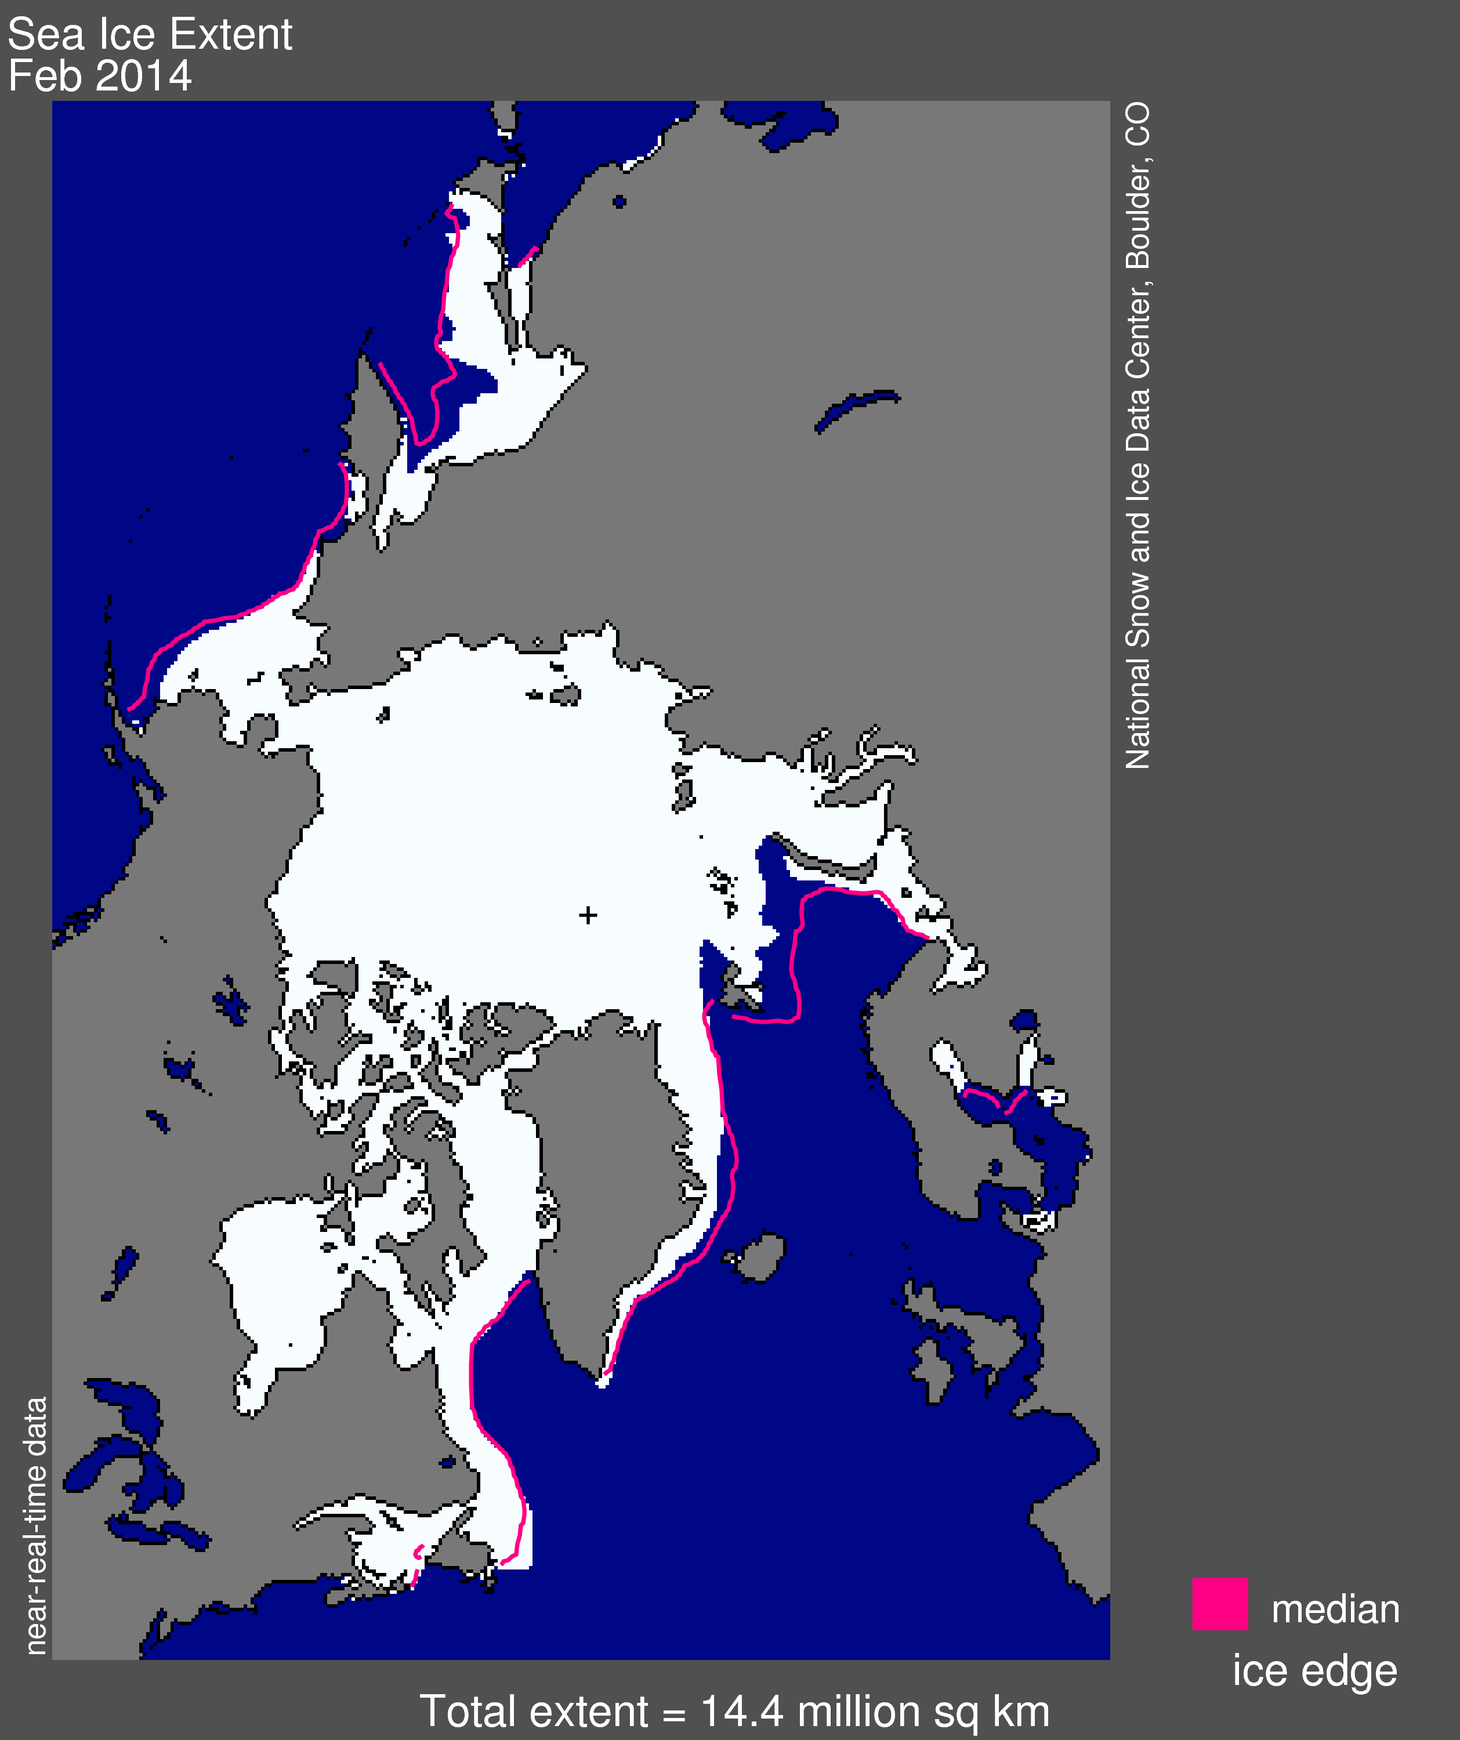
1. Arctic sea ice extent for February 2014 was 14.44 million square
kilometers (5.58 million square miles). The orange line shows the 1981
to 2010 median extent for that month. The black cross indicates the
geographic North Pole. Sea Ice Index data. About the data
Credit: National Snow and Ice Data Center
High-resolution image
Credit: National Snow and Ice Data Center
High-resolution image
Overall, sea ice grew slowly through the month of February. There were periods of declining ice, likely related to changes in ice motion. Bering Sea ice cover has been below average throughout winter, in contrast to the last several winters. Ice extent also remains below average in the Barents Sea and the Sea of Okhotsk, helping to keep the Arctic ice extent two standard deviations below the 1981 to 2010 average.
Conditions in context

Figure
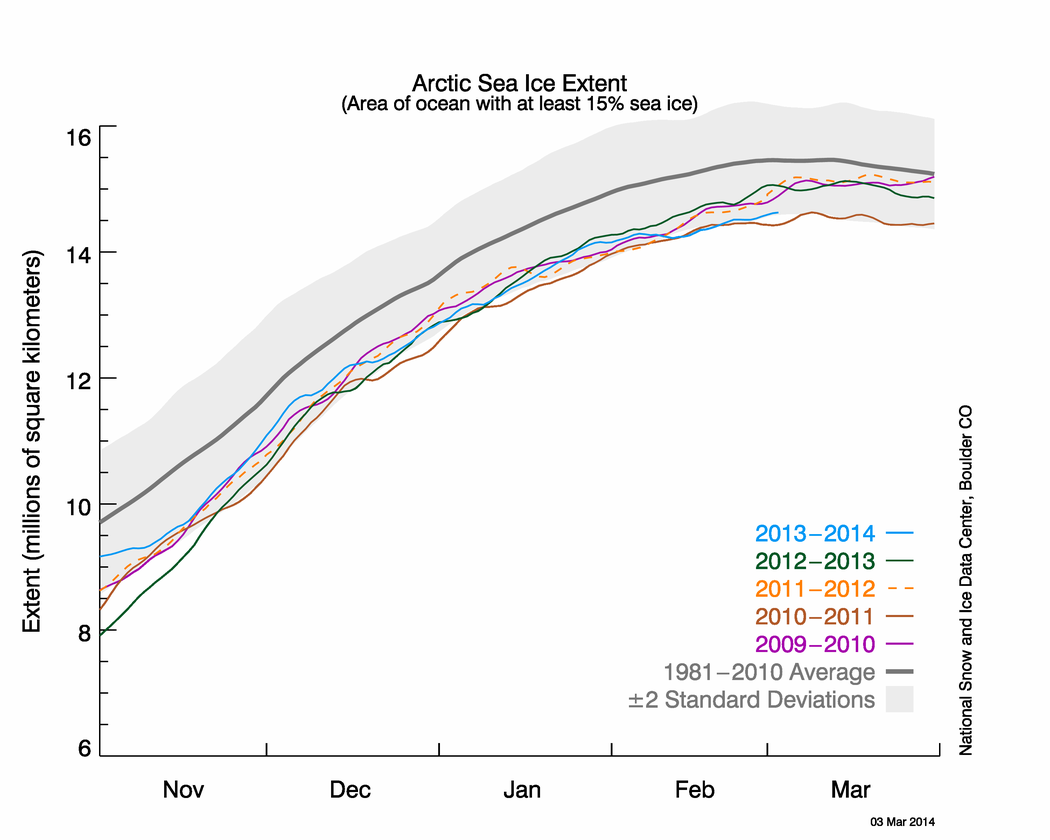
2. The graph above shows Arctic sea ice extent as of March 3, 2014,
along with daily ice extent data for five previous years. 2013-2014 is
shown in blue, 2012-2013 in green, 2011-2012 in orange, 2010-2011 in
brown, and 2009-2010 in purple. The 1981 to 2010 average is in dark
gray. Sea Ice Index data.
Credit: National Snow and Ice Data Center
High-resolution image
Credit: National Snow and Ice Data Center
High-resolution image
While the eastern half of the U.S. has suffered through a cold and sometimes snowy winter, conditions in the Arctic have been warmer than average. The Arctic in winter is still a very cold place and temperatures at the 925 mb level in the central Arctic averaged -25 to -15 degrees Celsius (-13 to 5 degrees Fahrenheit); however, this was 4 to 8 degrees Celsius (7 to 14 degrees Fahrenheit) above average for the month. The Arctic Oscillation settled into a near-neutral mode for February after swinging from a strong positive mode in December to a negative mode in January.
February 2014 compared to previous years
Figure
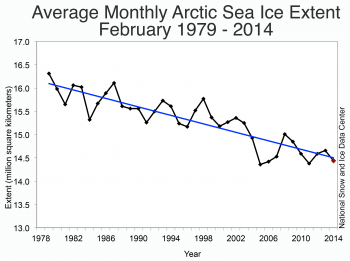
3. Monthly February ice extent for 1979 to 2014 shows a decline of
-3.0% per decade per decade relative to the 1981 to 2010 average.
Credit: National Snow and Ice Data Center
High-resolution image
Credit: National Snow and Ice Data Center
High-resolution image
The two Bs of the Arctic: Barents and Bering
Figure
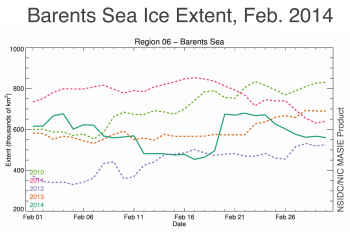
4a. Barents Sea ice extent during February from the NSIDC Multisensor
Analyzed Sea Ice Extent (MASIE) for the years 2010 through 2014. MASIE is produced daily by the U.S. National Ice Center based on human analysis of a variety of available satellite imagery.
Credit: National Snow and Ice Data Center and the National Ice Center
High-resolution image
Credit: National Snow and Ice Data Center and the National Ice Center
High-resolution image

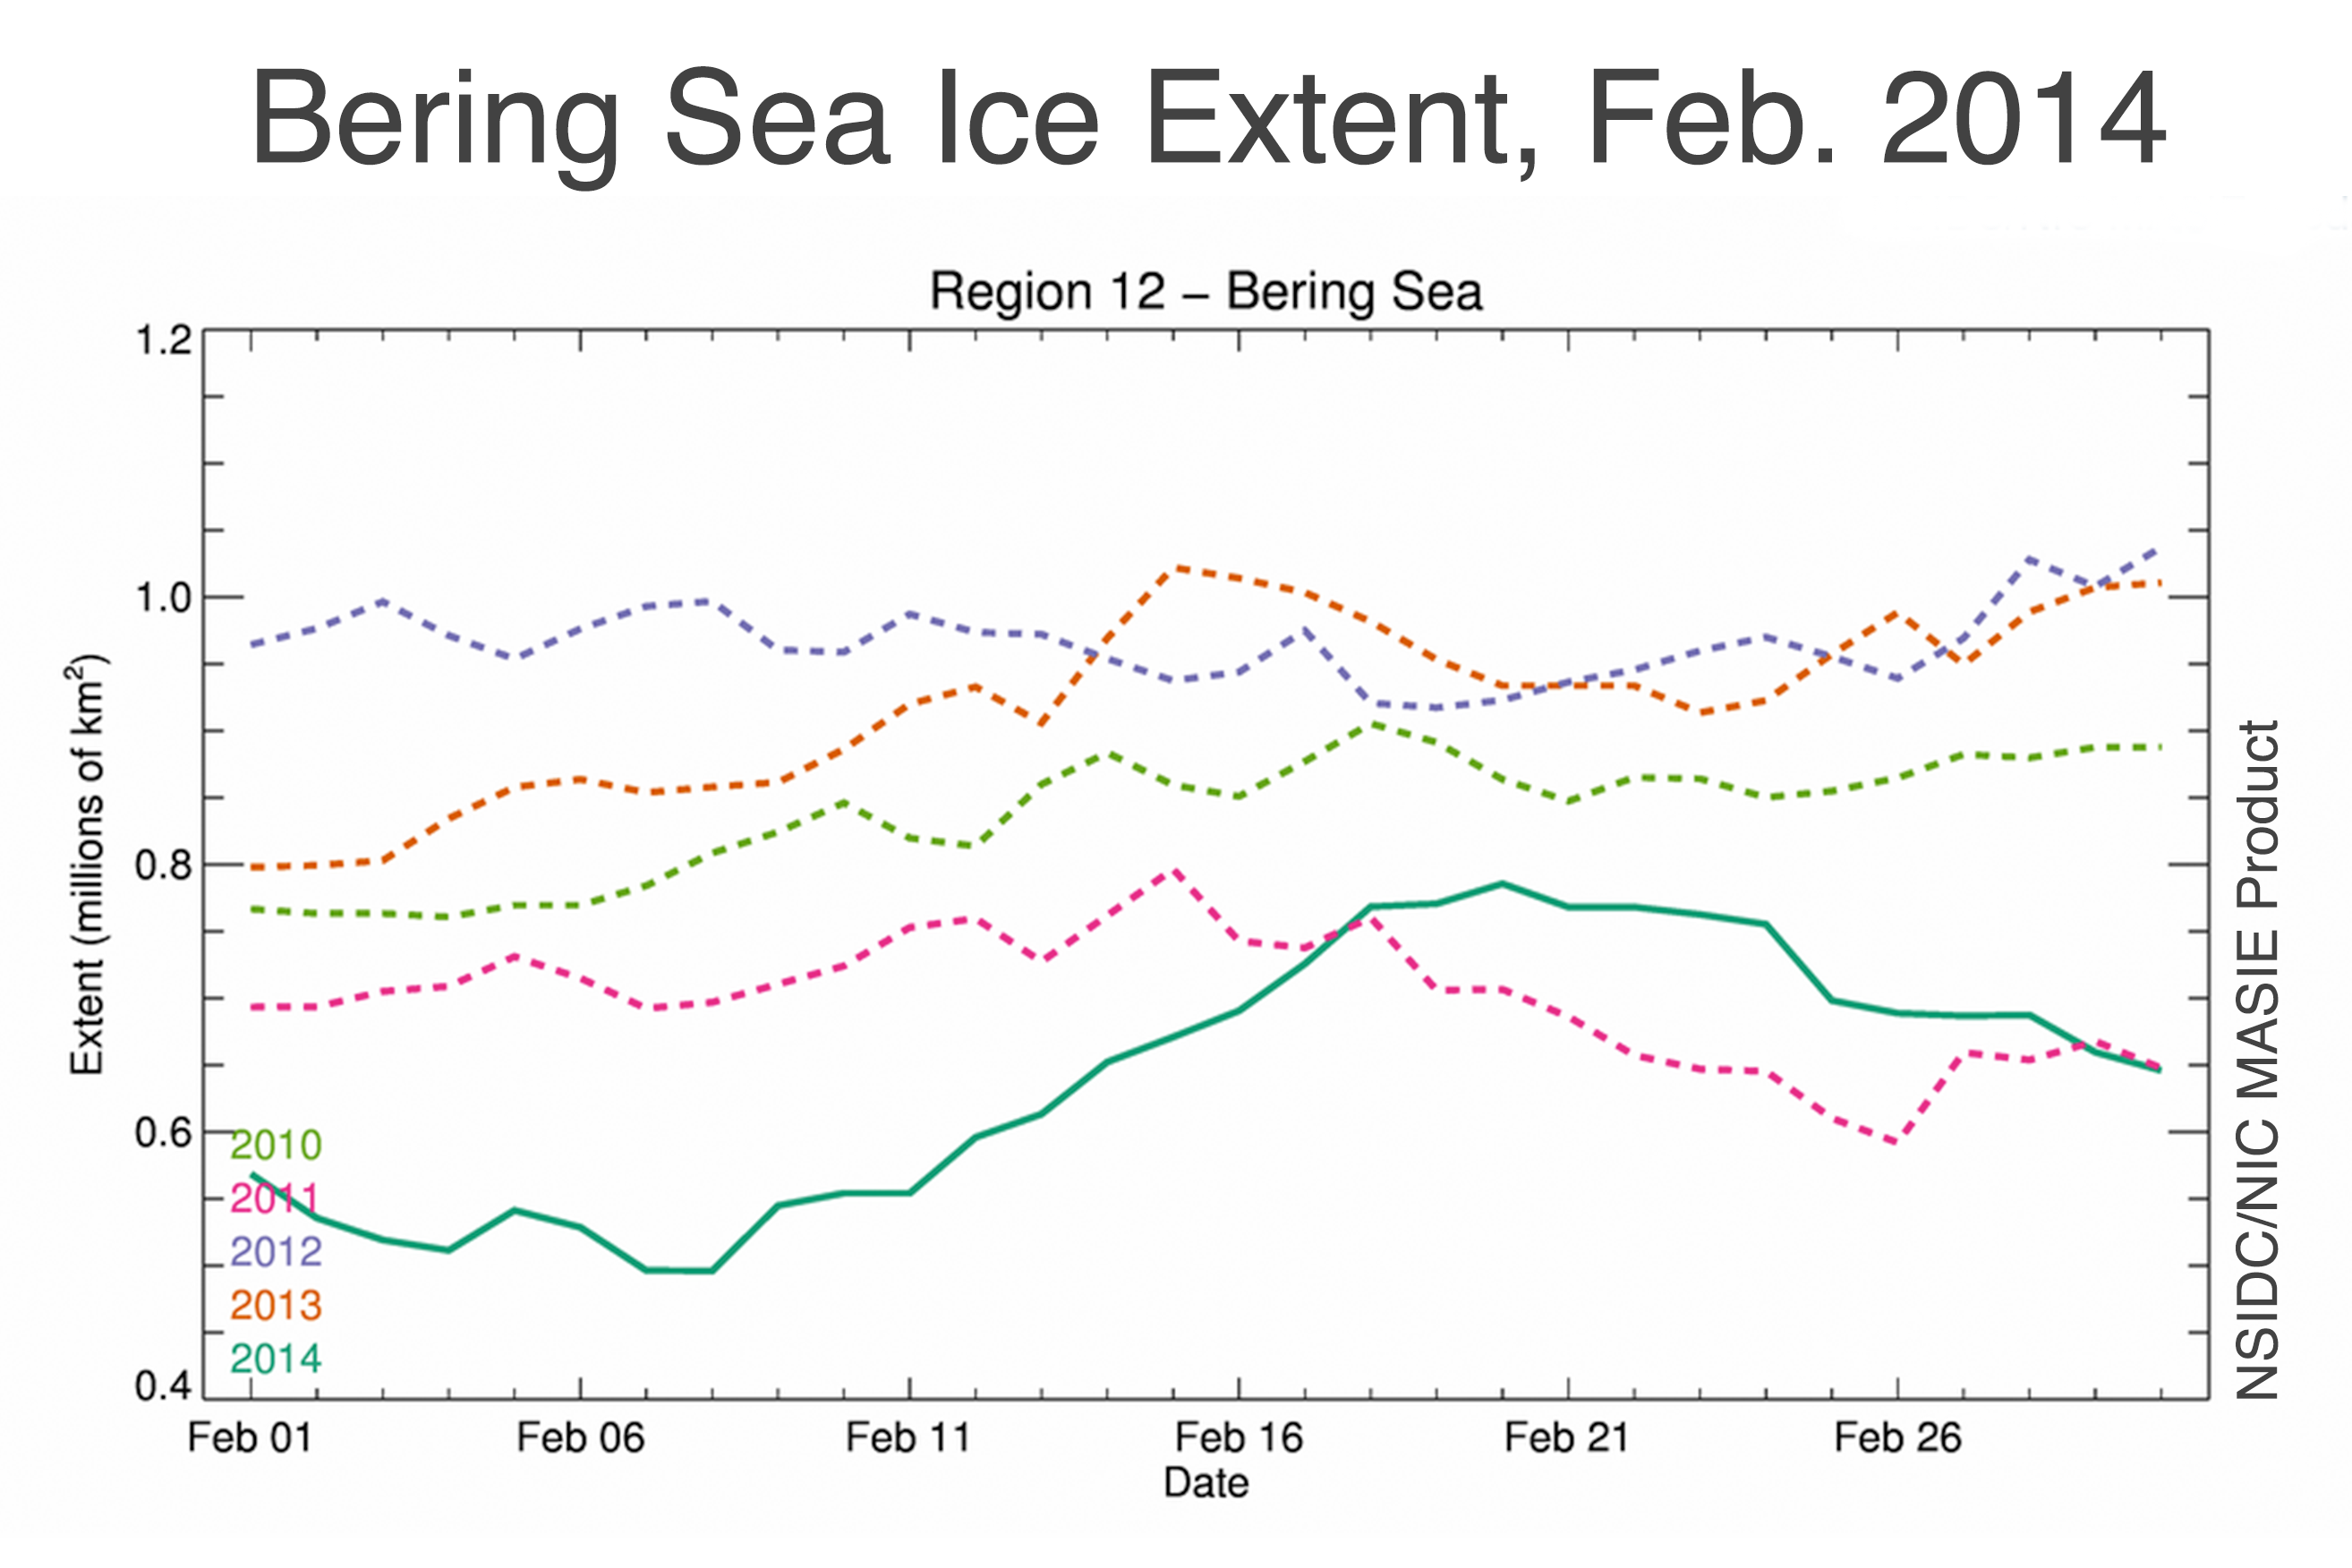
Figure
4b. Bering Sea ice extent during February from the NSIDC Multisensor
Analyzed Sea Ice Extent (MASIE) for the years 2010 through 2014. MASIE is produced daily by the U.S. National Ice Center based on human analysis of a variety of available satellite imagery.
Credit: National Snow and Ice Data Center and the National Ice Center
High-resolution image
Credit: National Snow and Ice Data Center and the National Ice Center
High-resolution image
In contrast to the Barents, the Bering Sea ice has had higher than average extent in recent years. However this year is different; Bering Sea ice extent has been below average through much of the winter. During mid-February, extent increased to a higher level, as seen in Multisensor Analyzed Sea Ice Extent (MASIE) data (Figure 4b), before a slight decline at the end of the month. This is in contrast with recent years in the Bering that have seen very high extents, even record levels .
The Bering Sea consists exclusively of seasonal ice with a large marginal ice zone where new, thin ice dominates. Sea ice in this region is quite sensitive to changes in temperatures and, particularly, winds. Cold winds from the north advect ice southward and aid new ice growth. Warm winds from the south impede ice growth and push the ice northward, reducing extent in the region. Recent winters have been characterized by predominantly north winds. This year represents a change with more zonal, east to west, winds in January and February. As with the Barents Sea, the Bering may be responding to climate variability, including the Pacific Decadal Oscillation, though the links are complex (Bond et al., 2003).
Winter and spring ice in the Bering Sea is of high importance to people living in the region, such as walrus hunters who go out on the ice or in boats during spring and early summer. Because ice conditions are so important, analyses and forecasts, such as those provided by the SEARCH Sea Ice for Walrus Outlook (SIWO), are particularly valuable. The SIWO program begins reporting on sea ice in late March or early April and continues through late June. The site provides sea ice imagery and analysis, reports from hunters in the field, and forecasts of future conditions. These reports are important for hunters to plan hunts and safely traverse the ice-infested waters.
miercuri, 26 februarie 2014
UM BOM TUBARÃO DAS LETRAS DEVE SABER QUE O PHODER JOGA-SE COM AS BRANCAS E COM AS PRETAS NUM XADREZ TALVEZ DE PETAS
e fazes diretos nos directos? a 26.02.2014 às 15:21
e o ajuste com c fica mais caro
isso é assaz raro
claro
que com c....já se vê
falta só aro
pra ficar bué de caro
e falta alho
pra ficar caro comu caralho?
isso é assaz raro
claro
que com c....já se vê
falta só aro
pra ficar bué de caro
e falta alho
pra ficar caro comu caralho?
De faço o calvário hoje? a 26.02.2014 às 15:24
não é que m'enoje
mas hoje fazer o calvário
dá um custo salafrário
e ser pregado em cruz
não me seduz
nem sequer ire ós cus
como o tal carlos no calvário de jesus
mas hoje fazer o calvário
dá um custo salafrário
e ser pregado em cruz
não me seduz
nem sequer ire ós cus
como o tal carlos no calvário de jesus
De JASUS calvário é de truz caro era otário a 26.02.2014 às 15:30
caro era romano também meu bem
cigarra deve ser grega
cigarra ao vil metal não s'apega
nem banqueiro hebreu tem
UM BOM TUBARÃO DAS LETRAS DEVE SABER QUE O PHODER JOGA-SE COM AS BRANCAS E COM AS PRETAS NUM XADREZ TALVEZ DE PETAS
PHODER O PODER É SABER FODER BRANCAS E PRETAS MESMO QUE SEJAM PERNETAS
cigarra deve ser grega
cigarra ao vil metal não s'apega
nem banqueiro hebreu tem
UM BOM TUBARÃO DAS LETRAS DEVE SABER QUE O PHODER JOGA-SE COM AS BRANCAS E COM AS PRETAS NUM XADREZ TALVEZ DE PETAS
PHODER O PODER É SABER FODER BRANCAS E PRETAS MESMO QUE SEJAM PERNETAS
Abonați-vă la:
Postări (Atom)